Ash Kamel Developer \ Tinkerer \ Referee
Projects
 ###TranSight
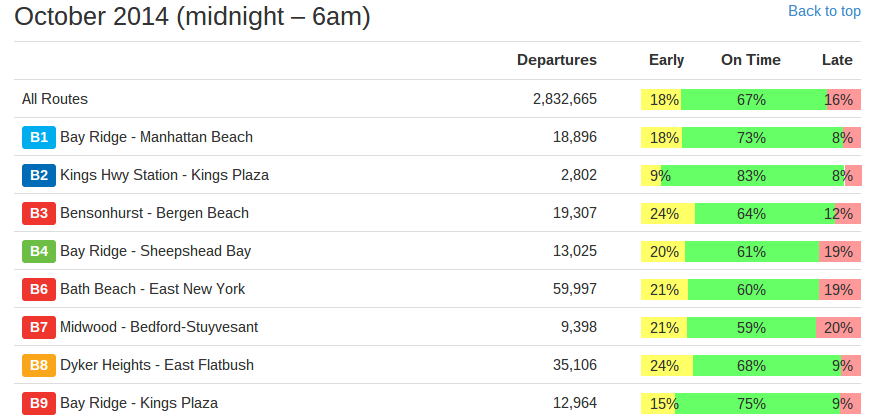
was a developer challenge hosted by the MTA, ATT were we developed and proposed a dashboard where policy makers, riders, academics and MTA staff would be able to easily see which subway and bus stops in NYC were favorable using our own tScoring system that would aggregate Disability Friendliness, Stop Environment, WIFI connectevity, Wait Time Predictions and On-Time Percentage for each stop.
 ###gitThreeView
see the code
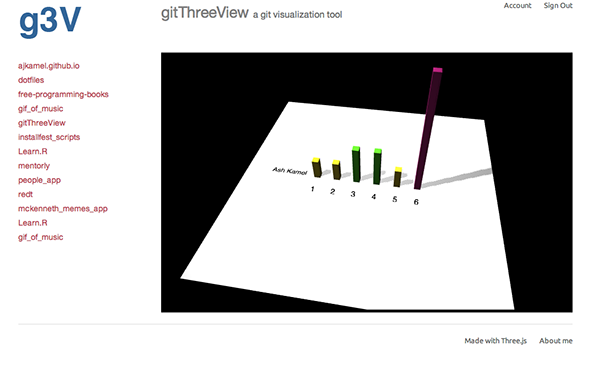
a simple app which you can use to visualize your Github repositories in 3D.
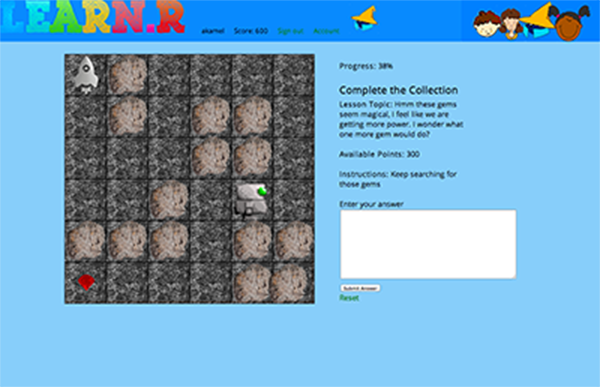 ###LearnR
see the code
A site for young students to learn code concepts, music, and more. At our core we want LearnR to create a fun, playful environment that introduces your children to fundamental concepts that we use throughout our life.
—
As part of the team to help build Audicus we integrated an existing ecommerce platform with an existing CMS.
—
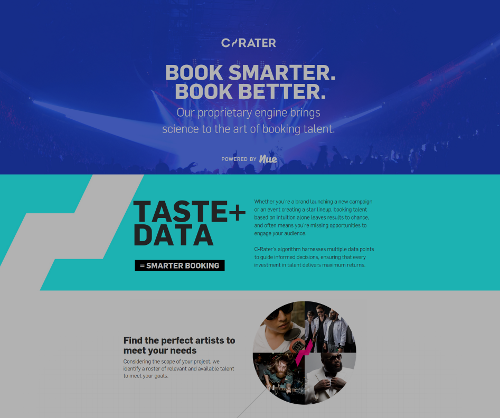
CRATER was a static page created for a client at Red Antler using implementing responsive design using SVG’s and Javascript.
—
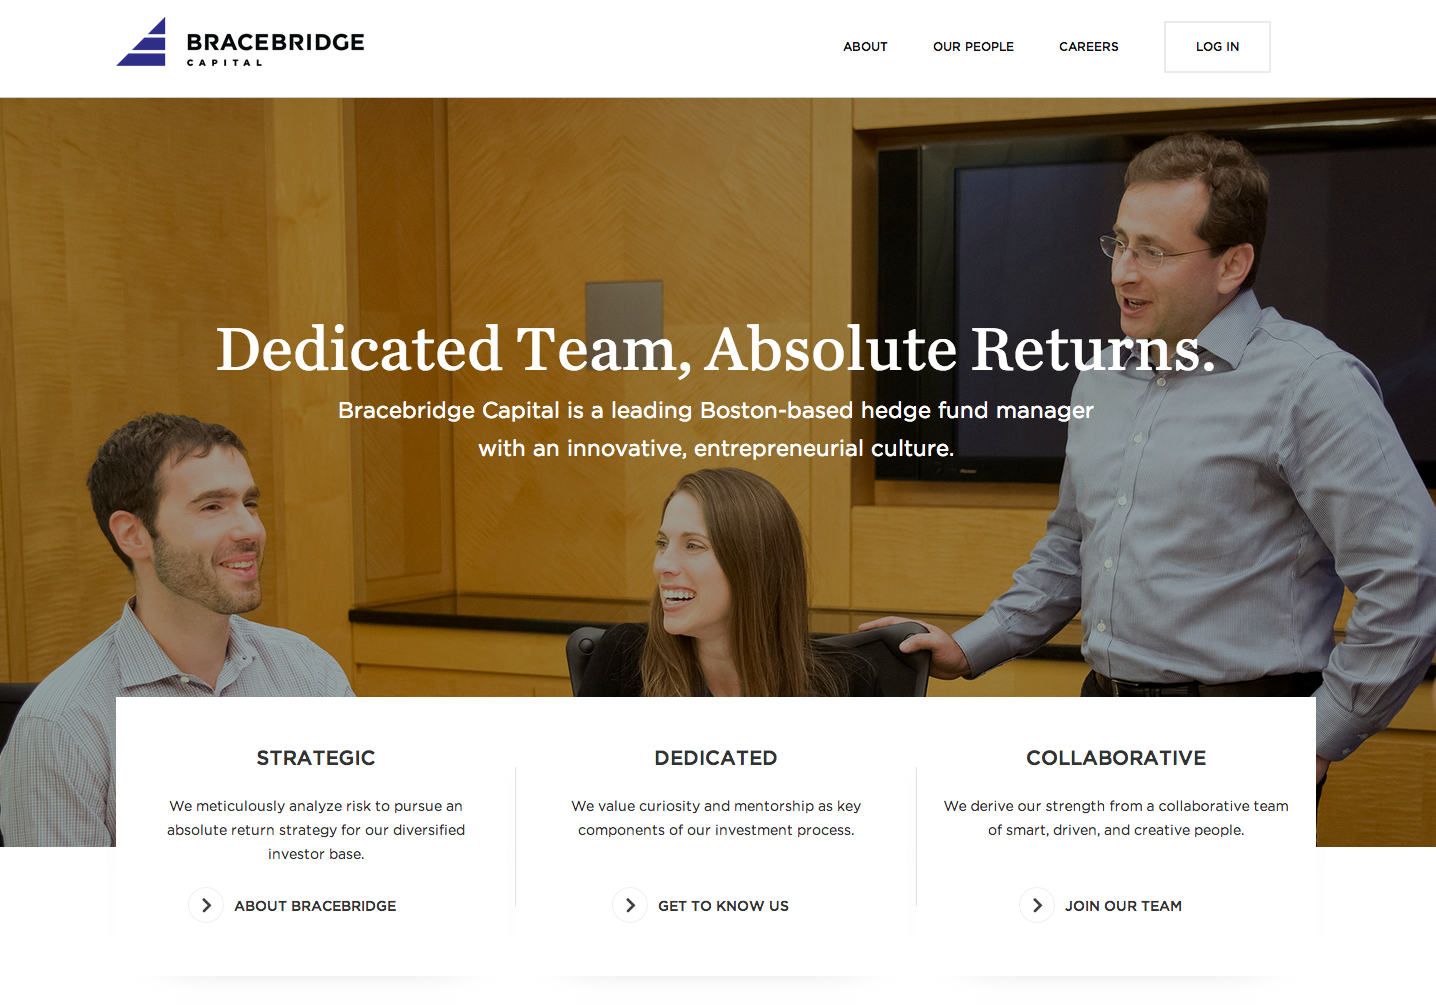
Bracebridge Capital was a project built for Red Antler. Implementing mobile responsive design, RSS feed parsing and caching.
 ###TrippinDots
see the code
We’re visualizing songs with dots using the Echo Nest and iTunes APIs. The concept was to create dots the represent the intensity of a note or sound and break the representation into to segments based on the Echonest analysis. The user can search for a song and it will pull the data load it and represent it dynamically.
Team Members: Alex Shook, Ash Kamel, Jesse Sessler, Verner D’souza
Tripping dots was created during an 8 hour hackathon at the Etsy Month Music Hackathon

